
The Diocese Executive Dashboard is available only for the assigned Diocese Executive. This post will guide you through the key components of the report.
Summary Diagnostic
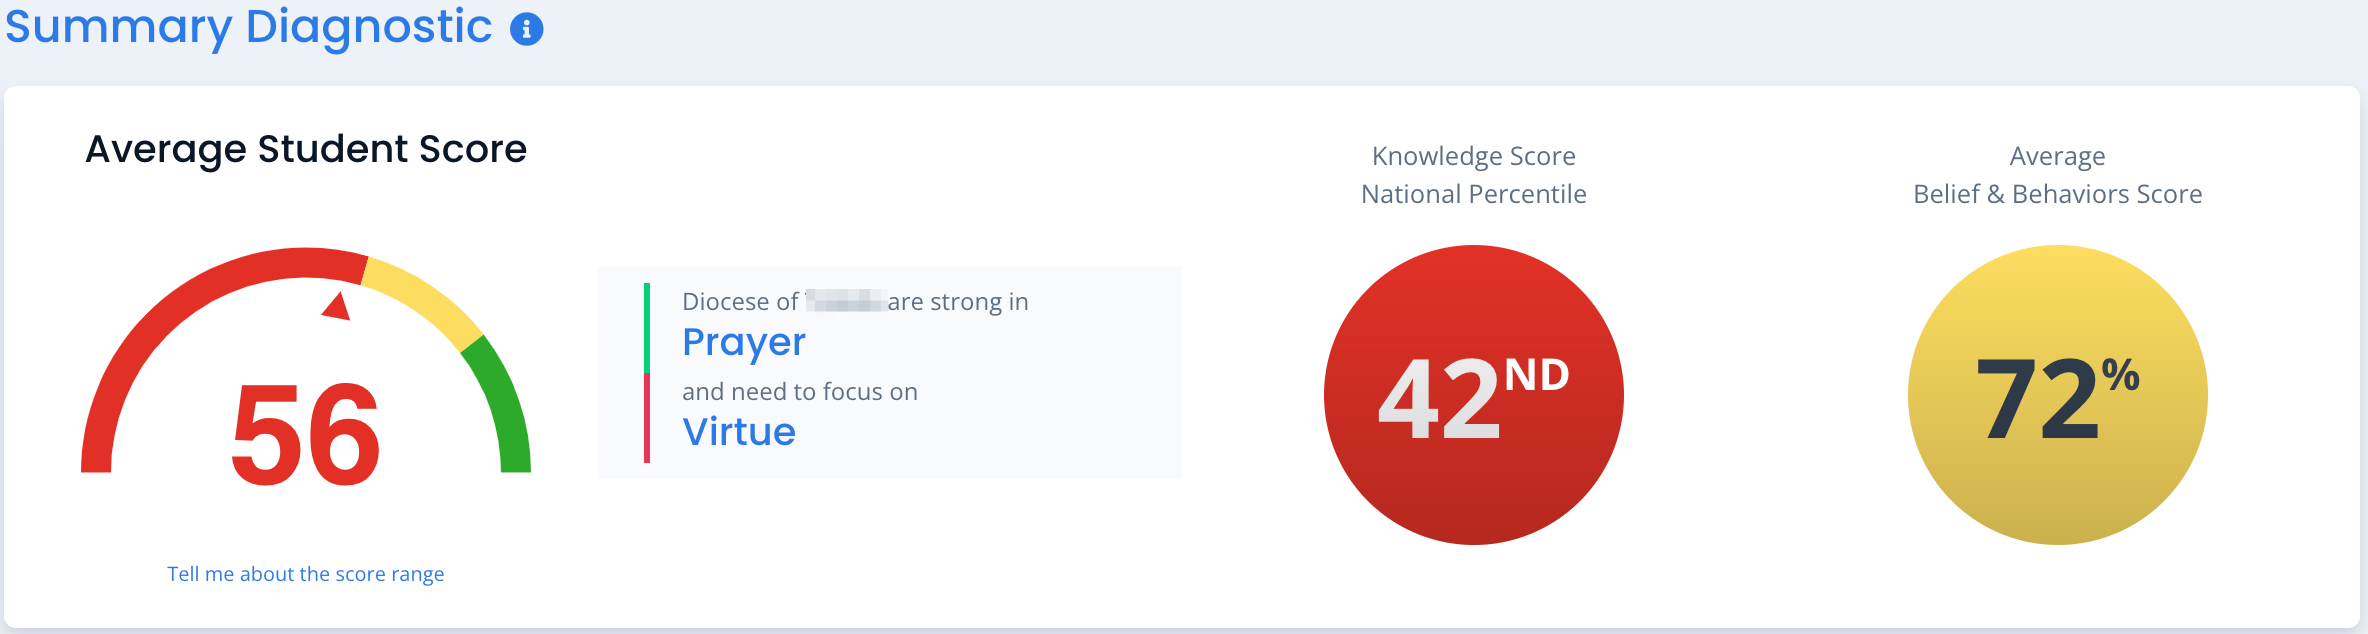
Here you see the average knowledge score of all Students in your diocese (including both schools and parishes), the strongest and weakest Domains, and how your Students’ average knowledge score compares nationally, Finally, you will see the average belief & behaviors score of all Students. This score represents the degree to which students’ anonymously-reported beliefs and behaviors align with living the Catholic Faith.
To view score distinctions between school and parish programs, use the Results Analyzer to create those specific queries.
School Scores

Here you see your Student scores distribution in high (80+%), mid (60-79%), and low (<60%) ranges, and the schools ranked by their Catholic Identity Score. The Catholic Identity Score is an assessment of Catholic culture based on the average knowledge, beliefs, and behaviors scores of your Students and Faculty. You will see the top five and bottom five schools. Clicking “Show All Schools” gives you the entire list ranked by Catholic Identity Score.
Student Snapshot
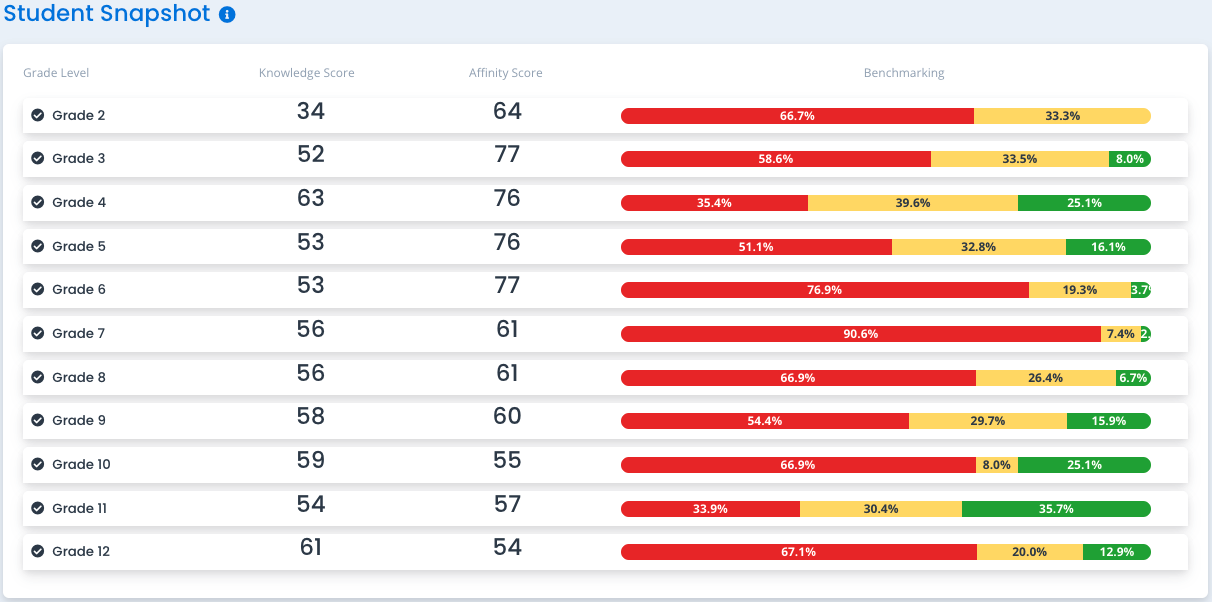
This section shows the average Student knowledge scores by grade level across all schools and parishes in your diocese. For each grade level tested, the table displays the average knowledge score, average belief & behaviors score, and Student score distribution in high (80+%), mid (60-79%), and low (<60%) ranges for all Students in that grade level.
Principal Snapshot

Here you see your diocese’s average Principal results including: average knowledge score and corresponding national percentile, strongest & weakest Domain, and average self-reported beliefs and behaviors score. You will also find a list of Principals sorted from highest to lowest scores with a link to the school’s ARK reporting dashboard.
Faculty Snapshot
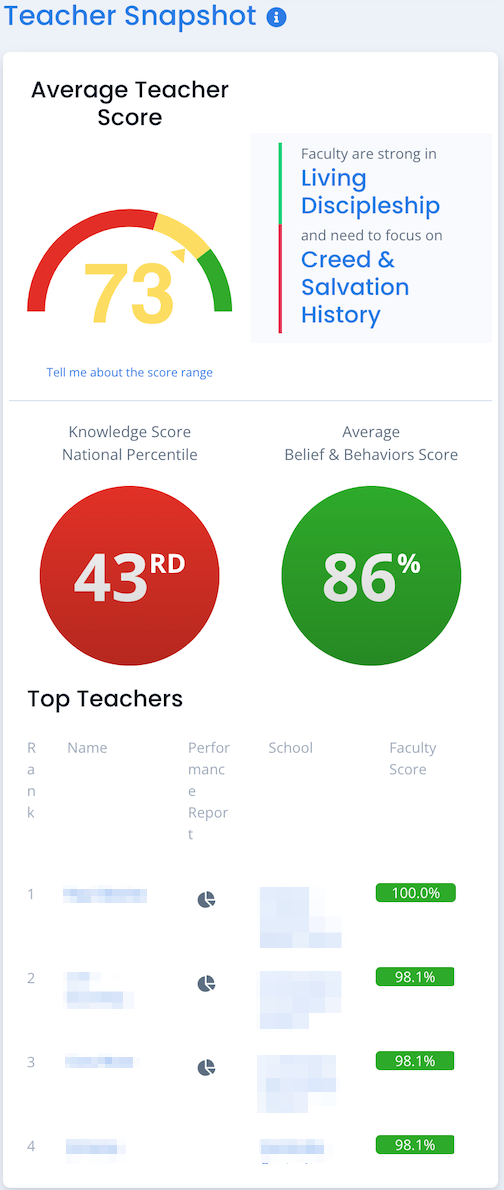
Here you see your diocese’s average Faculty results including: average knowledge score and corresponding national percentile, strongest & weakest Domain, and average self-reported beliefs and behaviors score. You will also find a list of Faculty sorted from highest to lowest scores. Clicking a Faculty member’s name takes you to that faculty-member’s individual test result.
Faculty with religion classes have a pie chart icon you can click to see that specific Teacher’s Performance Report.
Domain Knowledge Scores
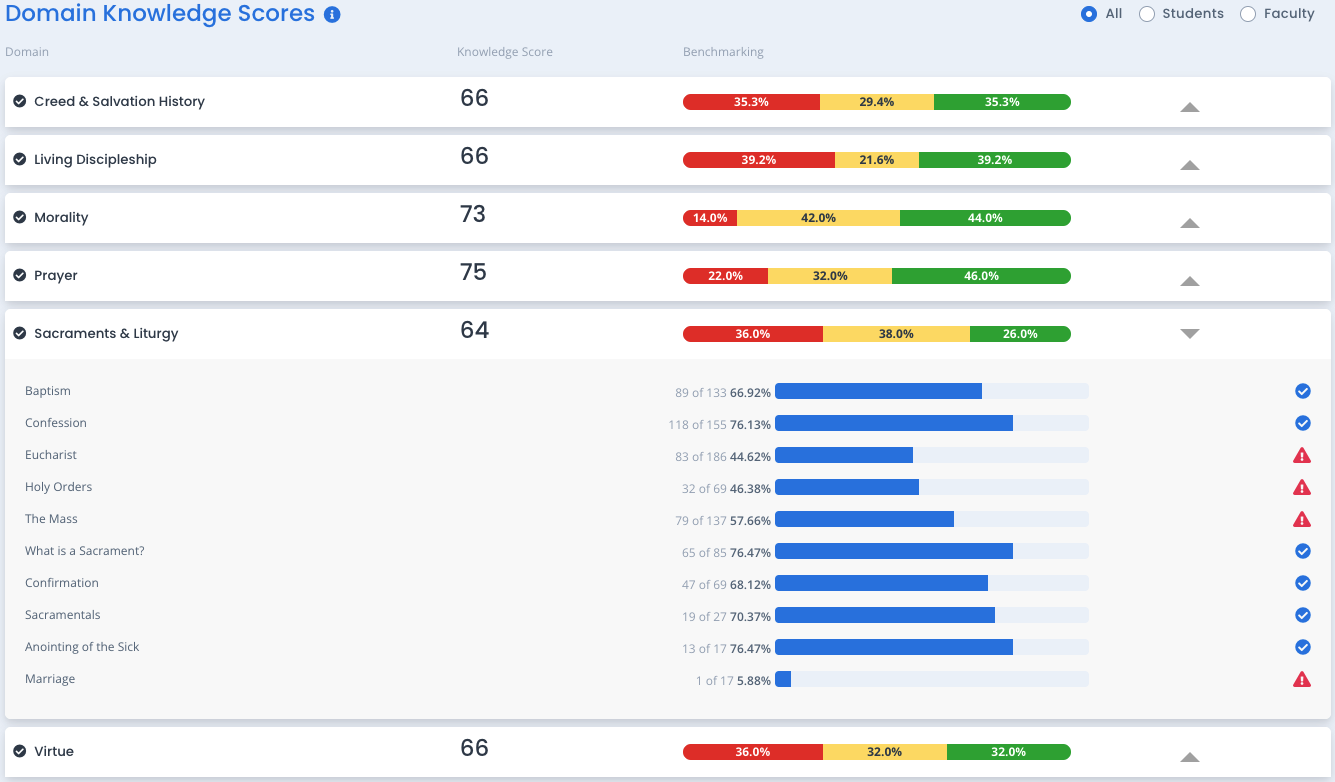
This section lets you drill down to examine knowledge scores on each of the 6 Domains. You also see the percentage of test-takers in your diocese that scored high (80+%), moderate (between 60 and 79%) and low (<60%).
Toggle the selection to show data for All / Students/ Faculty. Pivot the domain to see total numbers of correct answers by topic.
This detail will help you assess coverage of your curriculum, identify strengths to celebrate and opportunities to address. Note that there are different topics assessed between the various grade level tests and the Faculty test, so the topics listings will change given the toggle selection.
Domain Belief & Behavior Scores

This section shows the respondents’ anonymous, self-reported beliefs & behaviors across each of the 6 Domains including the percentage responding in Strongly Aligned / Somewhat Aligned / Not Aligned.
Toggle the selection to show All / Students / Faculty. Pivot the Domain to reveal topic breakdowns showing the percentage responding as Strongly Aligned. Note that there are different topics assessed between the various grade level tests and the Faculty test, so the topics listings will change given the toggle selection.
Results Over Time
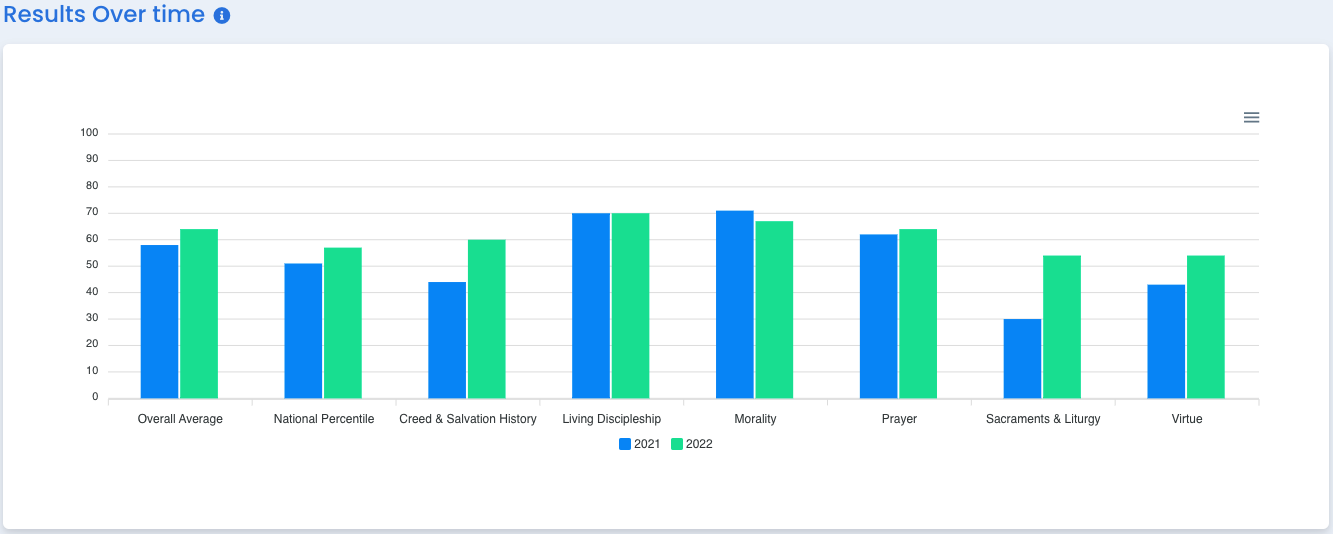
This section shows a comparison of Student performance on ARK this year compared to those who took the ARK test last year. This helps to show the impact your efforts are having on the growth of your Students.