
The Center Administrator Dashboard is available only for the the Center Administrator and the Diocese Executive. This post will guide you through the key components of the report.
School Snapshot
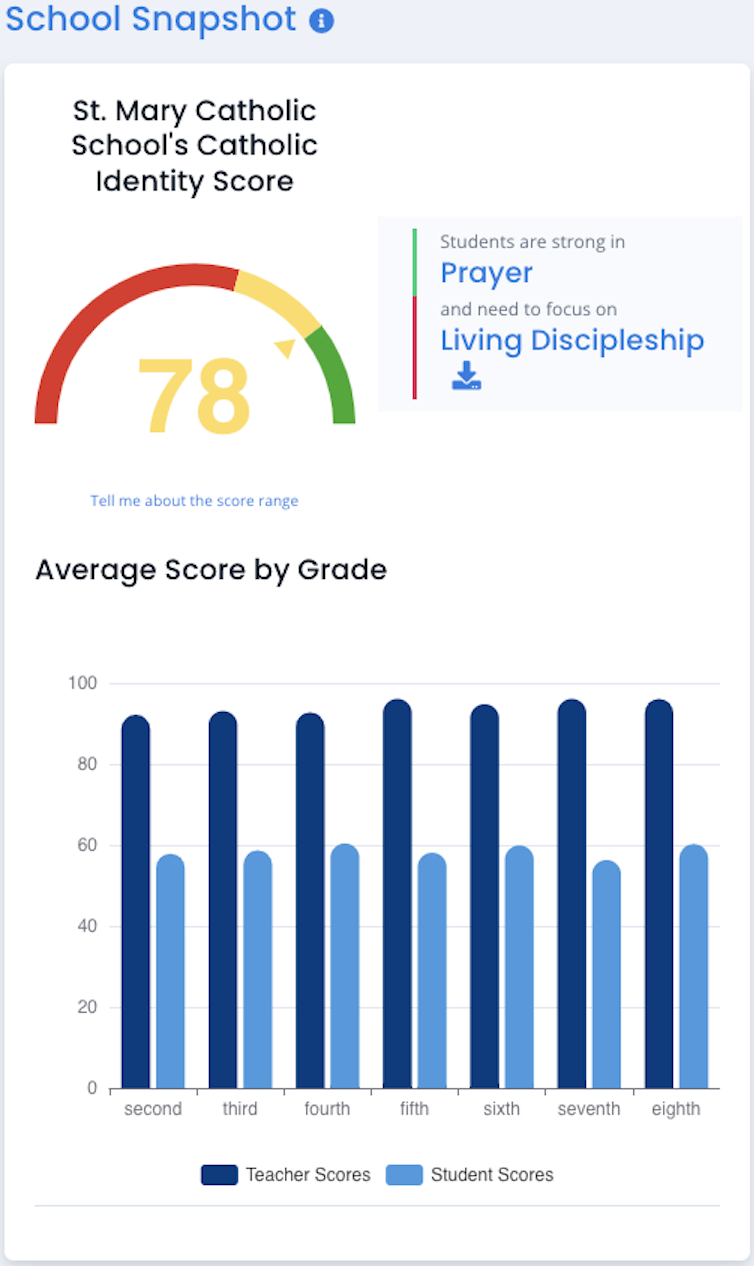
Here you see your school’s Catholic Identity Score, which is an assessment of Catholic culture based on the average knowledge, beliefs, and behavior scores of your Students and Faculty.
Your school’s strongest and weakest Domains are displayed and includes a download link that offers tips to improve and enrich your culture. You will also find a chart showing the average score by grade for both Teachers and Students.
Student Snapshot
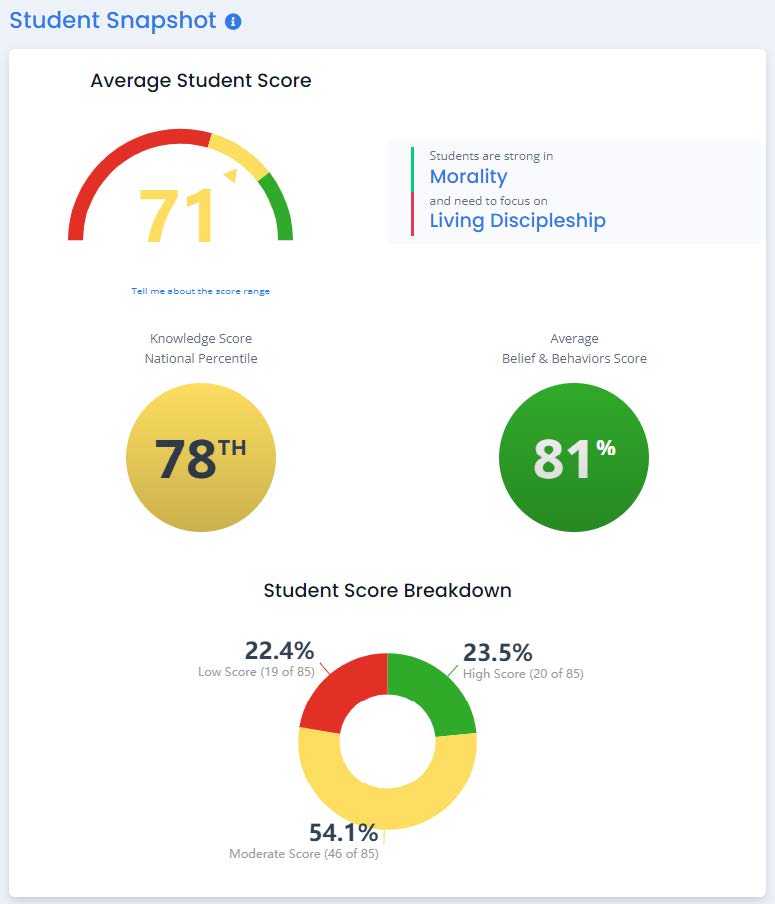
This section summarizes all Student results including: The average knowledge score, strongest and weakest Domain, student knowledge score national percentile, average belief and behavior score, and student score distribution in high (80+%), mid (60-79%) and low (<60%) ranges.
Grade Level Snapshot
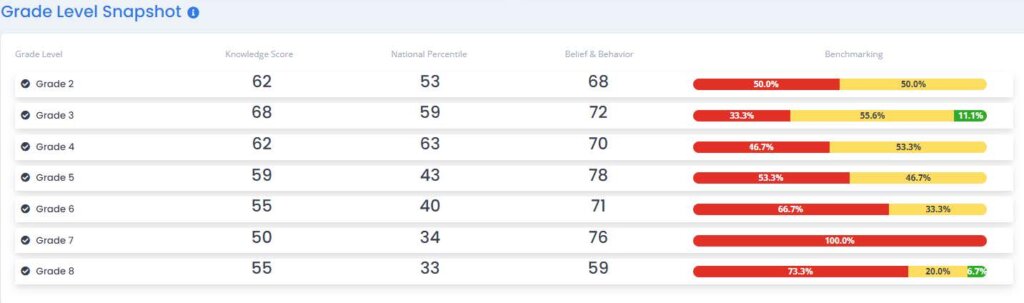
This section lets you see the average knowledge score, belief and behavior score (when more than 5 students), and knowledge score national percentile of each grade level. This aggregates multiple class sections into one grade-level view. There is also a Student score distribution in high (80%+), moderate (60-79%), and low (59% and below) ranges for each grade.
Faculty Snapshot
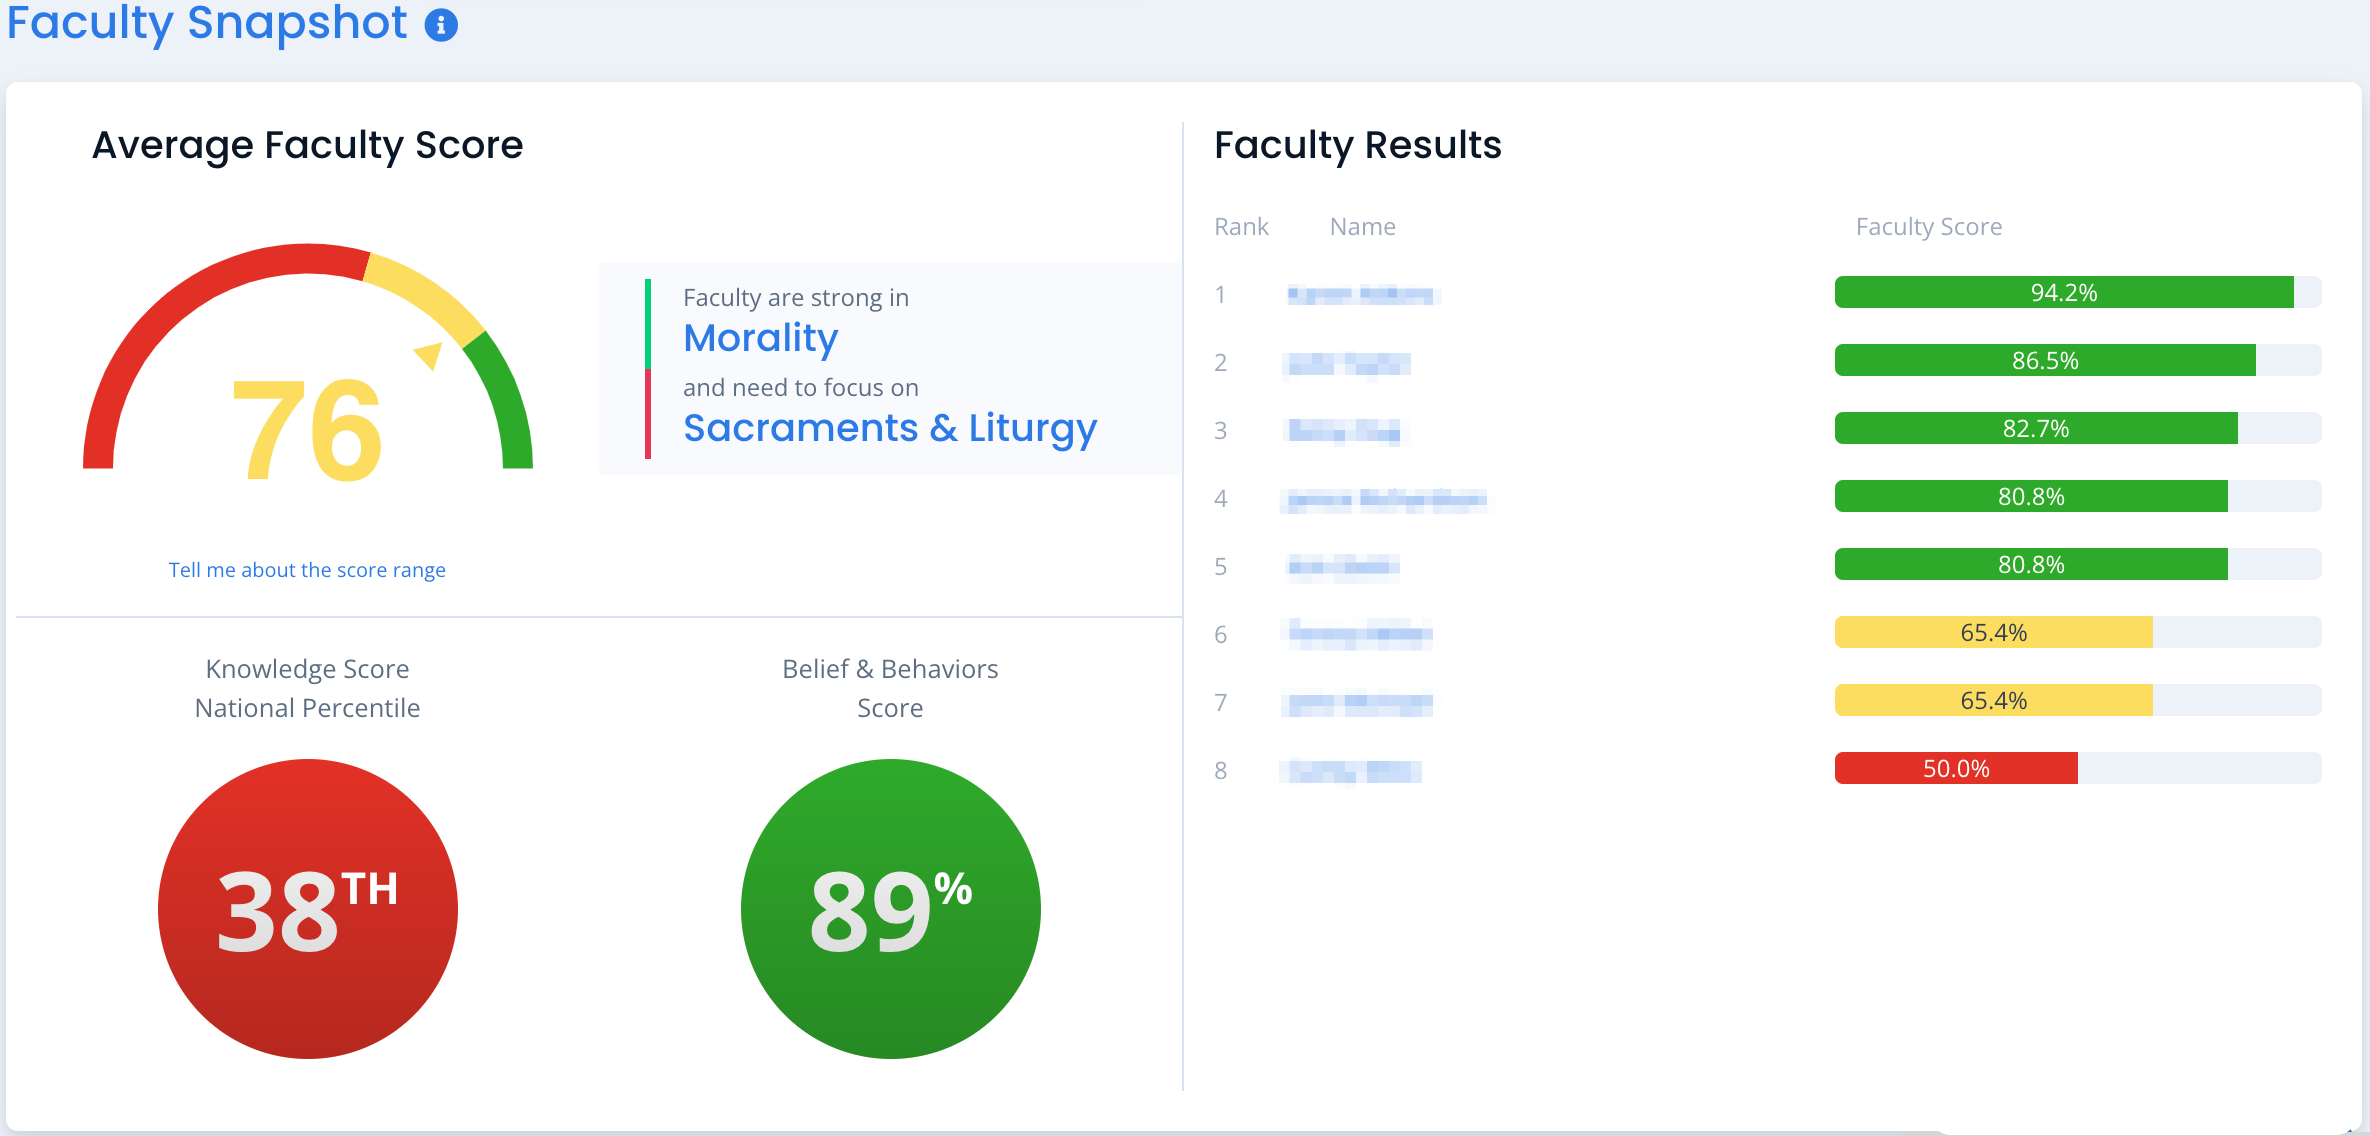
Here you see your school’s average Faculty results including: average knowledge score and corresponding national percentile, strongest & weakest Domain, and average self-reported beliefs and behaviors. You will also find a list of Faculty sorted from highest to lowest knowledge scores.
Student Results by Teacher
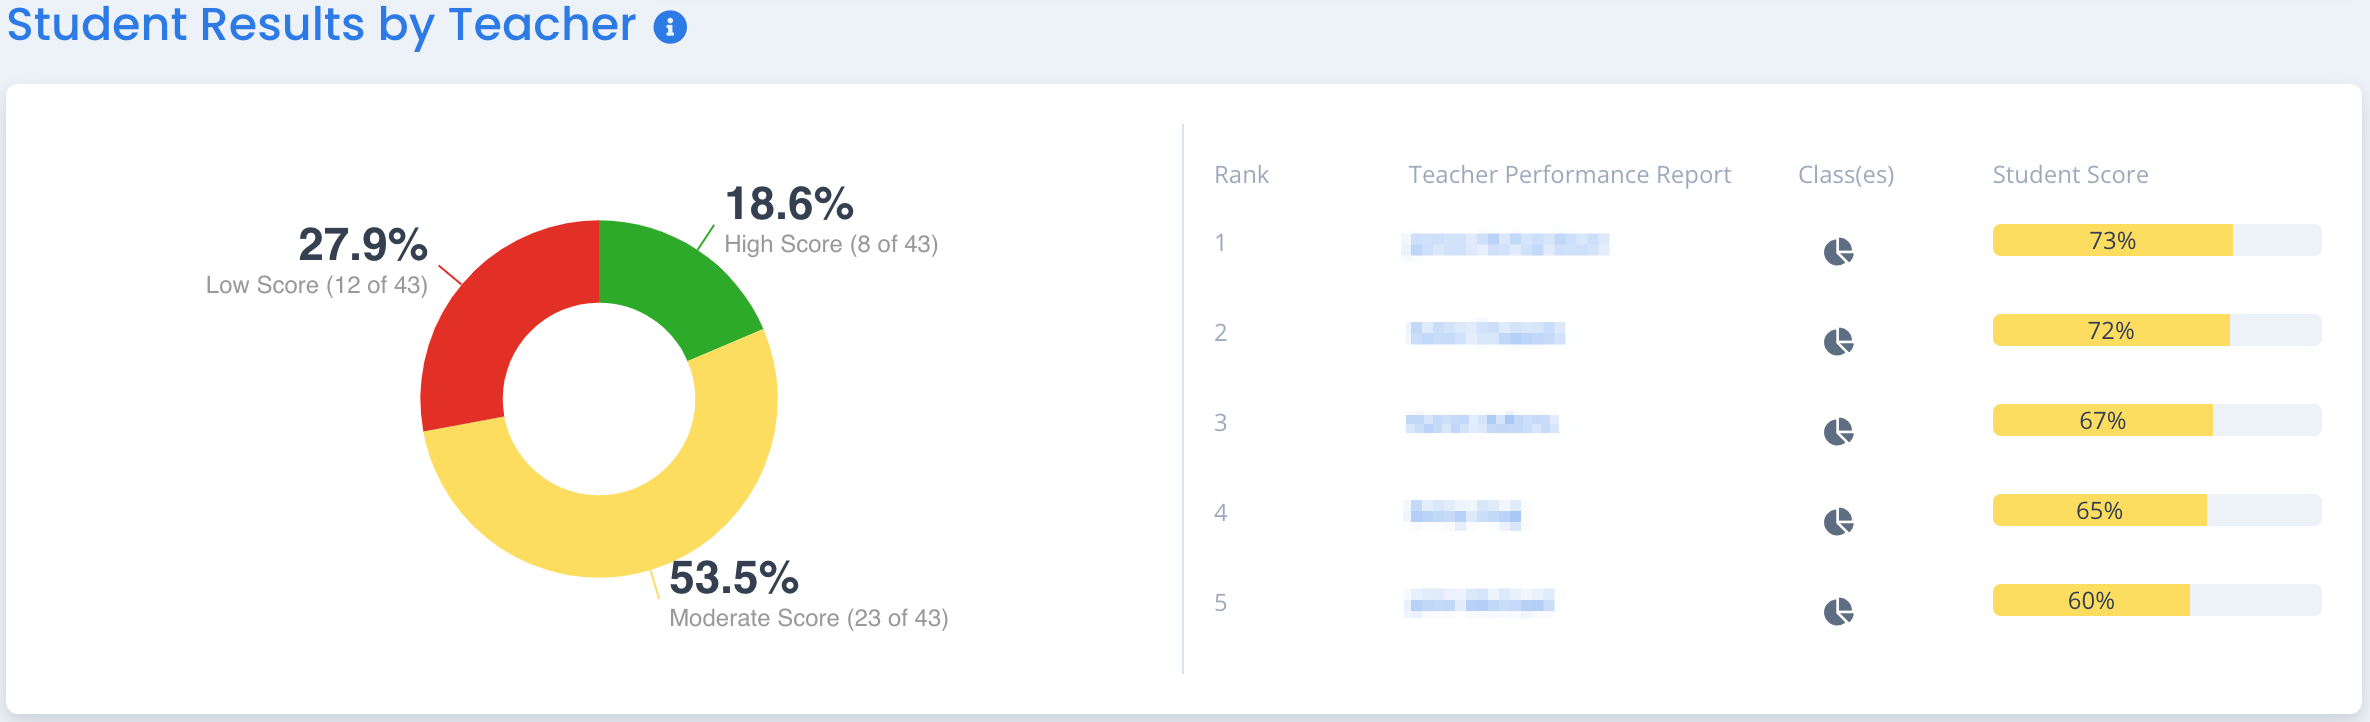
This section lets you see the Student score distribution in high (80+%), mid (60-79%), and low (<60%) ranges and the average class score by Teacher.
Clicking on the Teacher name brings you to their Performance Report. Clicking on the pie chart in the Class(es) column takes you to that Teacher’s Dashboard where you will find student reports.
Student and Teacher Knowledge Comparison
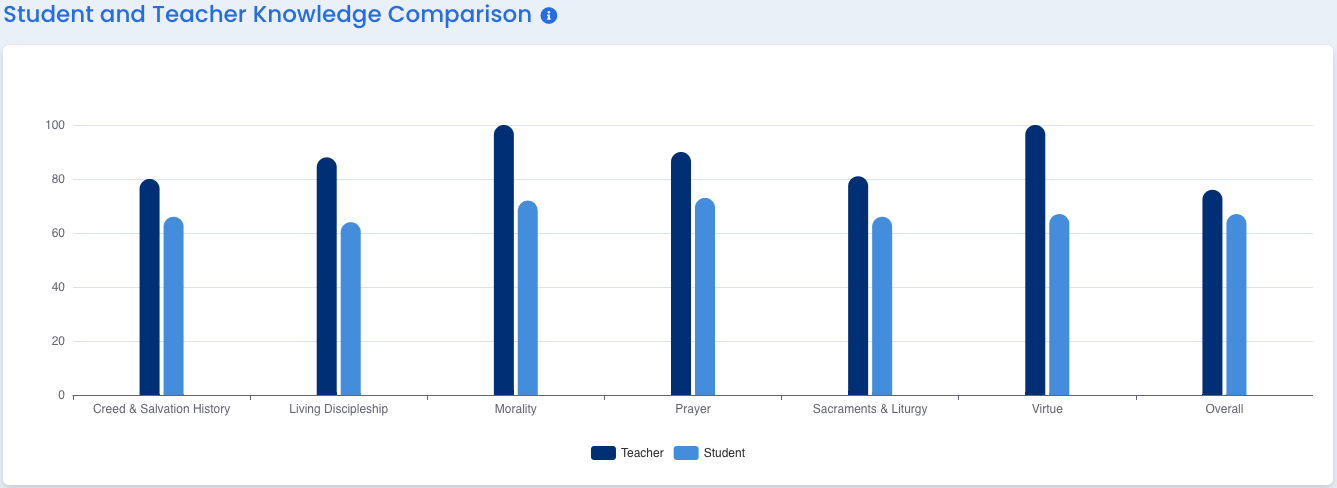
Here you will see a side-by-side comparison of the average Teacher’s knowledge score per Domain and the average Student score across the entire school.
Domain Knowledge Scores
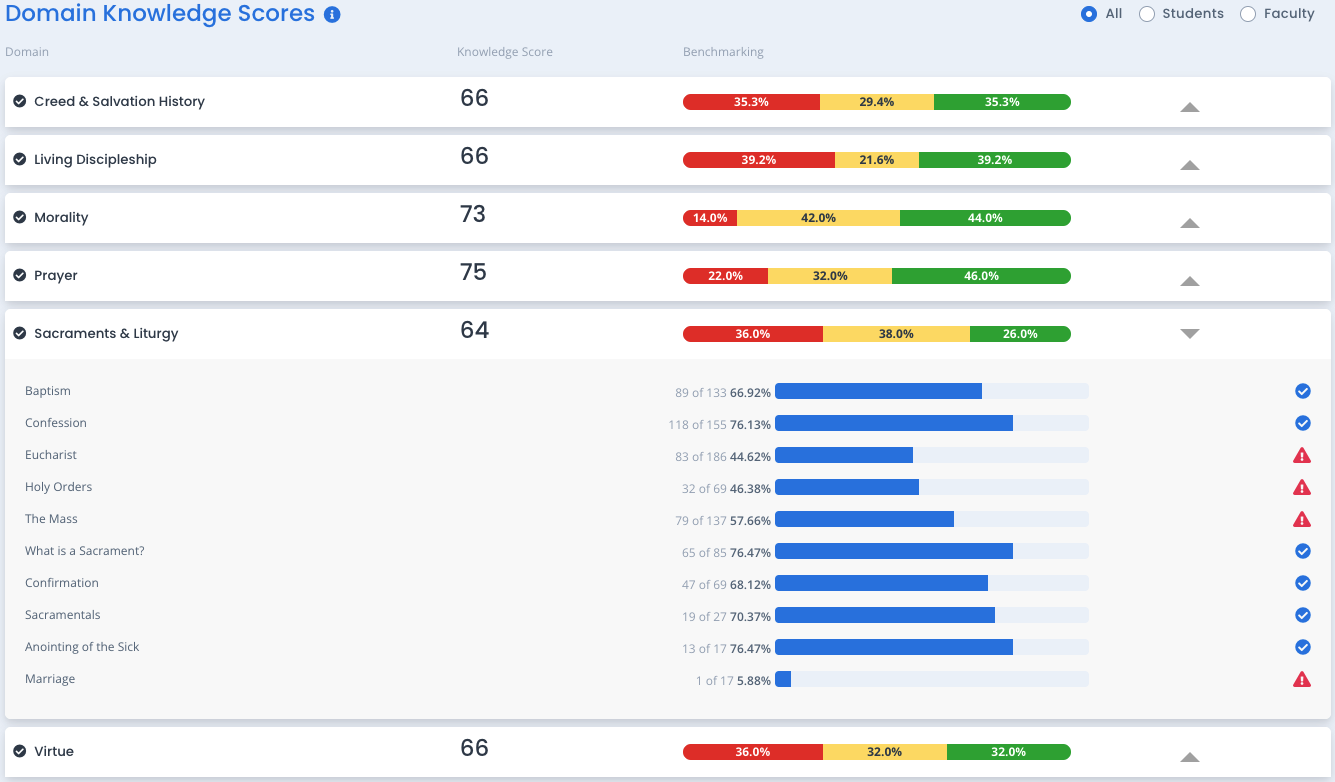
This section lets you drill down to examine knowledge scores on each of the 6 domains. Toggle the selection to show data for All / Students/ Faculty. Pivot the domain to see total numbers of correct answers by topic.
This detail will help you assess coverage of your curriculum, identify strengths to celebrate and opportunities to address. You also see the percentage of test-takers that scored high (80+%), moderate (between 60 and 79%) and low (<60%).
Domain Belief & Behavior Scores
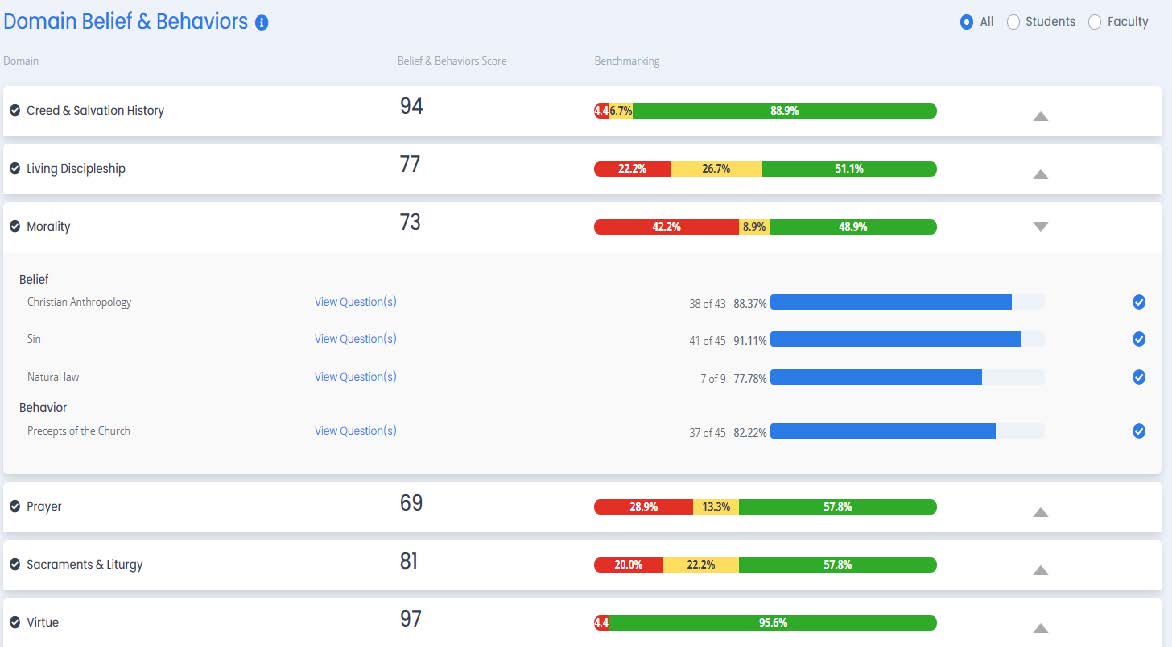
This section shows the respondents’ anonymous, self-reported beliefs & behaviors across each of the 6 Domains including the percentage responding in Strongly Aligned / Somewhat Aligned / Not Aligned.
Toggle the selection to show All / Students / Faculty. Pivot the Domain to reveal topic breakdowns showing the percentage responding as Somewhat and Strongly Aligned. Click “View Question(s)” to see the questions asked and the grade level(s) in which they’re asked for a deeper understanding of strengths and opportunities.
Results Over Time
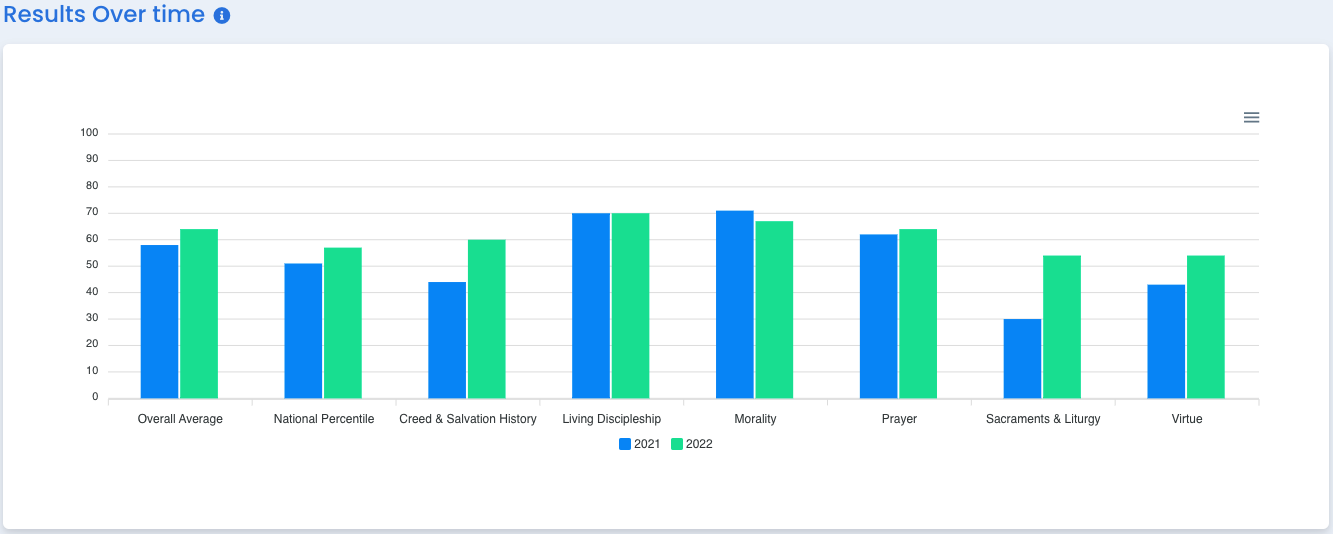
This section shows a performance comparison the the school’s Students on ARK this year compared to the previous years’ Students. This helps to show the impact your efforts are having on the growth of your Students.
