The Teacher Performance Report is available only for the Center Administrator and the Diocese Executive. This post will guide you through the key components of the report.
Teacher Results
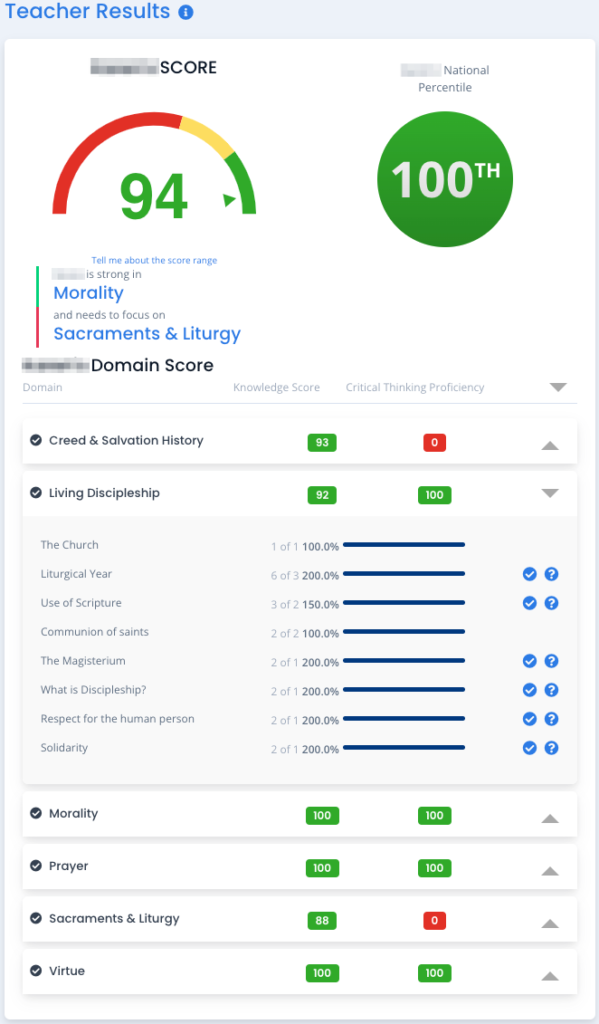
Here you see a summary of the selected teacher’s knowledge score, national percentile, and strongest and weakest Domain.
Pivot the arrows on the right to see the Domain scores, number of correct responses per topic, and summary of the teacher’s critical thinking proficiency.
NOTE: For any incorrect responses, clicking the blue question mark icon shows you the question(s), the teacher’s response(s), and the correct answer(s).
Teacher Effectiveness
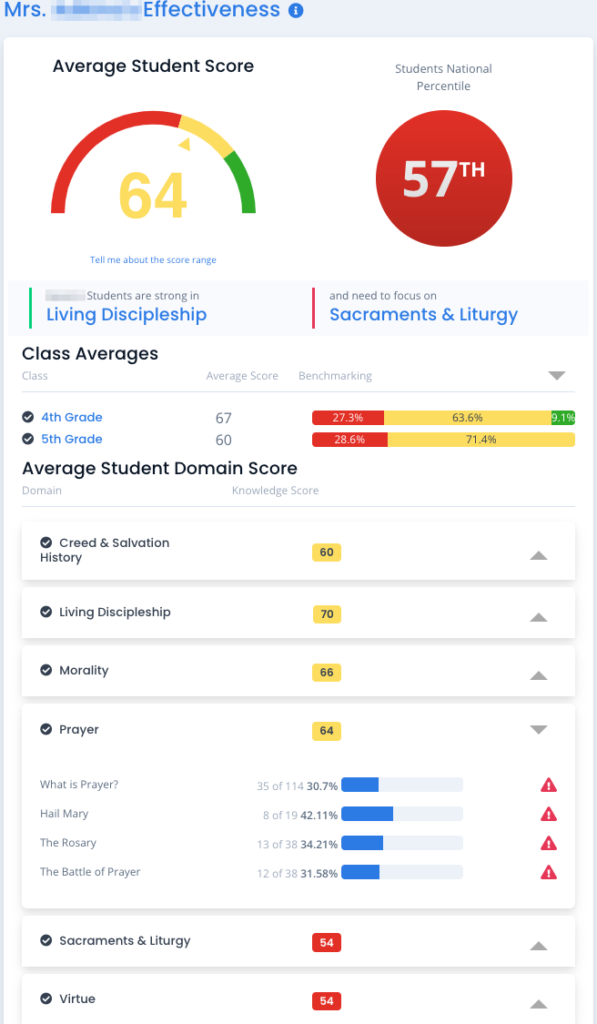
Here you see the Teacher Effectiveness as evidenced by the average student score across all students they teach, the national percentile for that average, and strongest and weakest Domains for students taught by this teacher. When you pivot the Class Averages button, you also see a breakdown of the class(es) taught, with the average score and the percent and count of those who scored 80% and above (green), 60-79 (yellow), and 59 or below (red) per class. Class Domain results are included to provide a more complete comparison.
Clicking on any Class name will bring you to the Teacher Dashboard for that Class.
Student and Teacher Knowledge Comparison
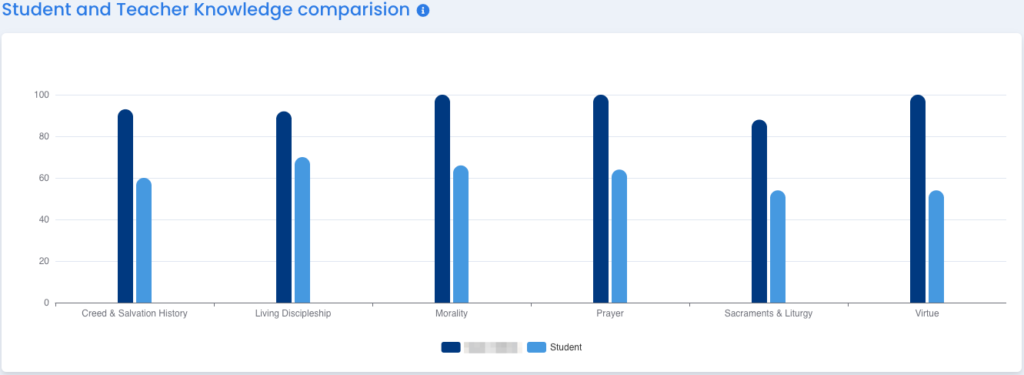
Here you will see a side-by-side comparison of the Teacher’s knowledge score per Domain and their average Student score.
Results Over Time
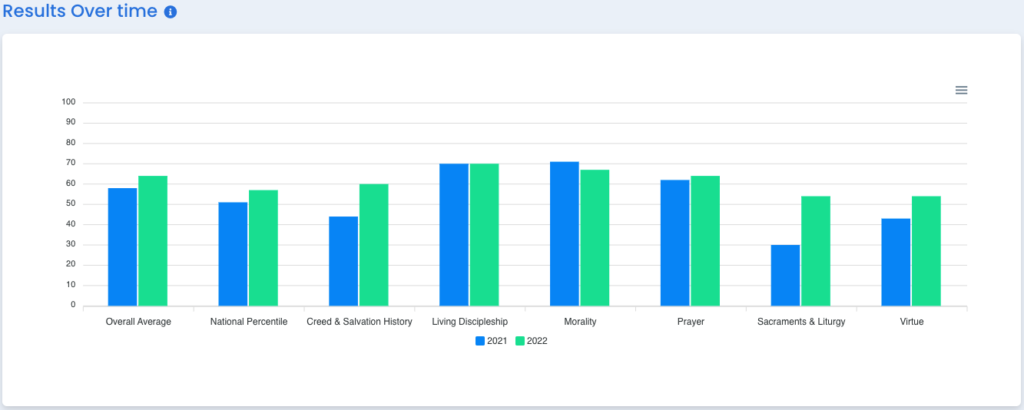
This section shows you how this teacher’s students performed on ARK this year compared to how those same students did last year. This helps to show the impact the Teacher is having on the growth of their students.
Lesson Recomendations
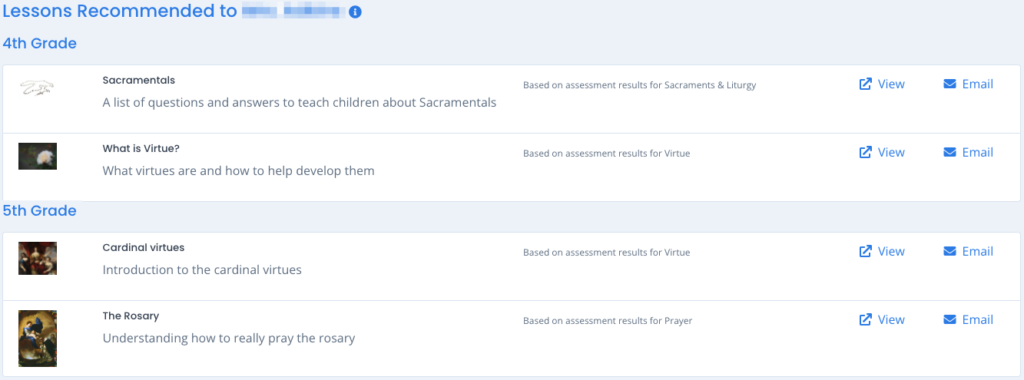
This section shows you the two free resources per class, suggested by ARK to support the class’s learning needs based on its weakest Domain on the ARK assessment. You can view these in a new window or email them as needed.

